Fleming GIS Work
Welcome to my site! This first blog post shows some of my GIS, design and programming work from Fleming College .
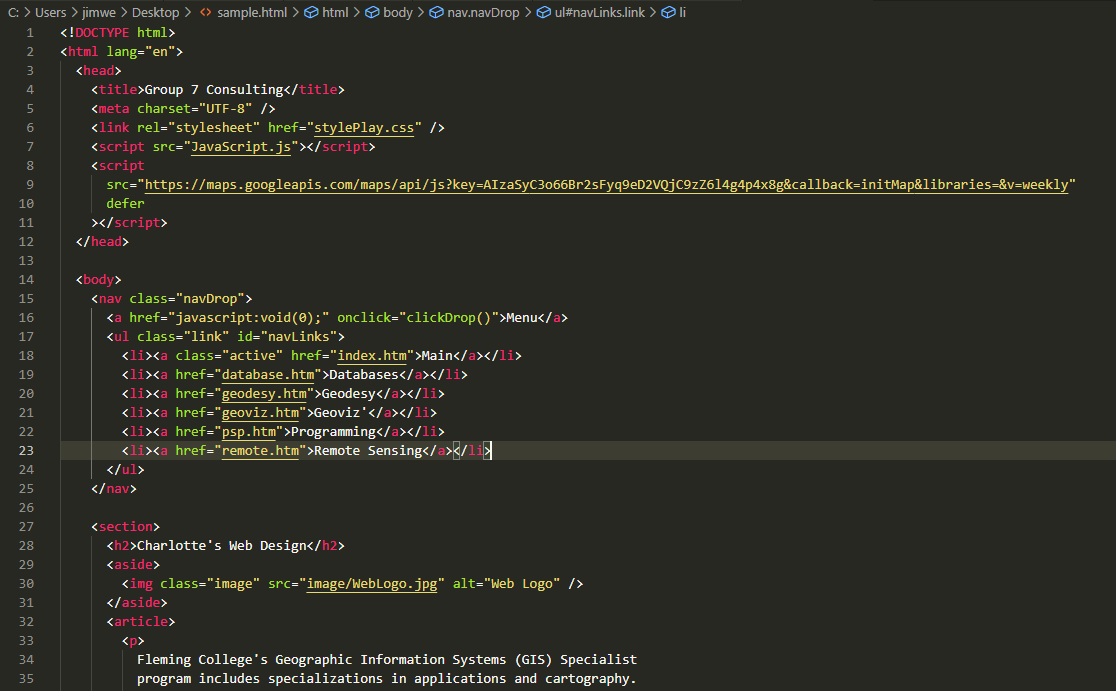
The past couple of months I have been working with multiple softwares and completing projects in Geovisualization, Database Design, Spatial Analysis and Python programming. Below are some of my sample work that I have created using ArcGIS Pro, Adobe Illustrator, ArcMap, Survey 123, ArcPy and Visual Studio.
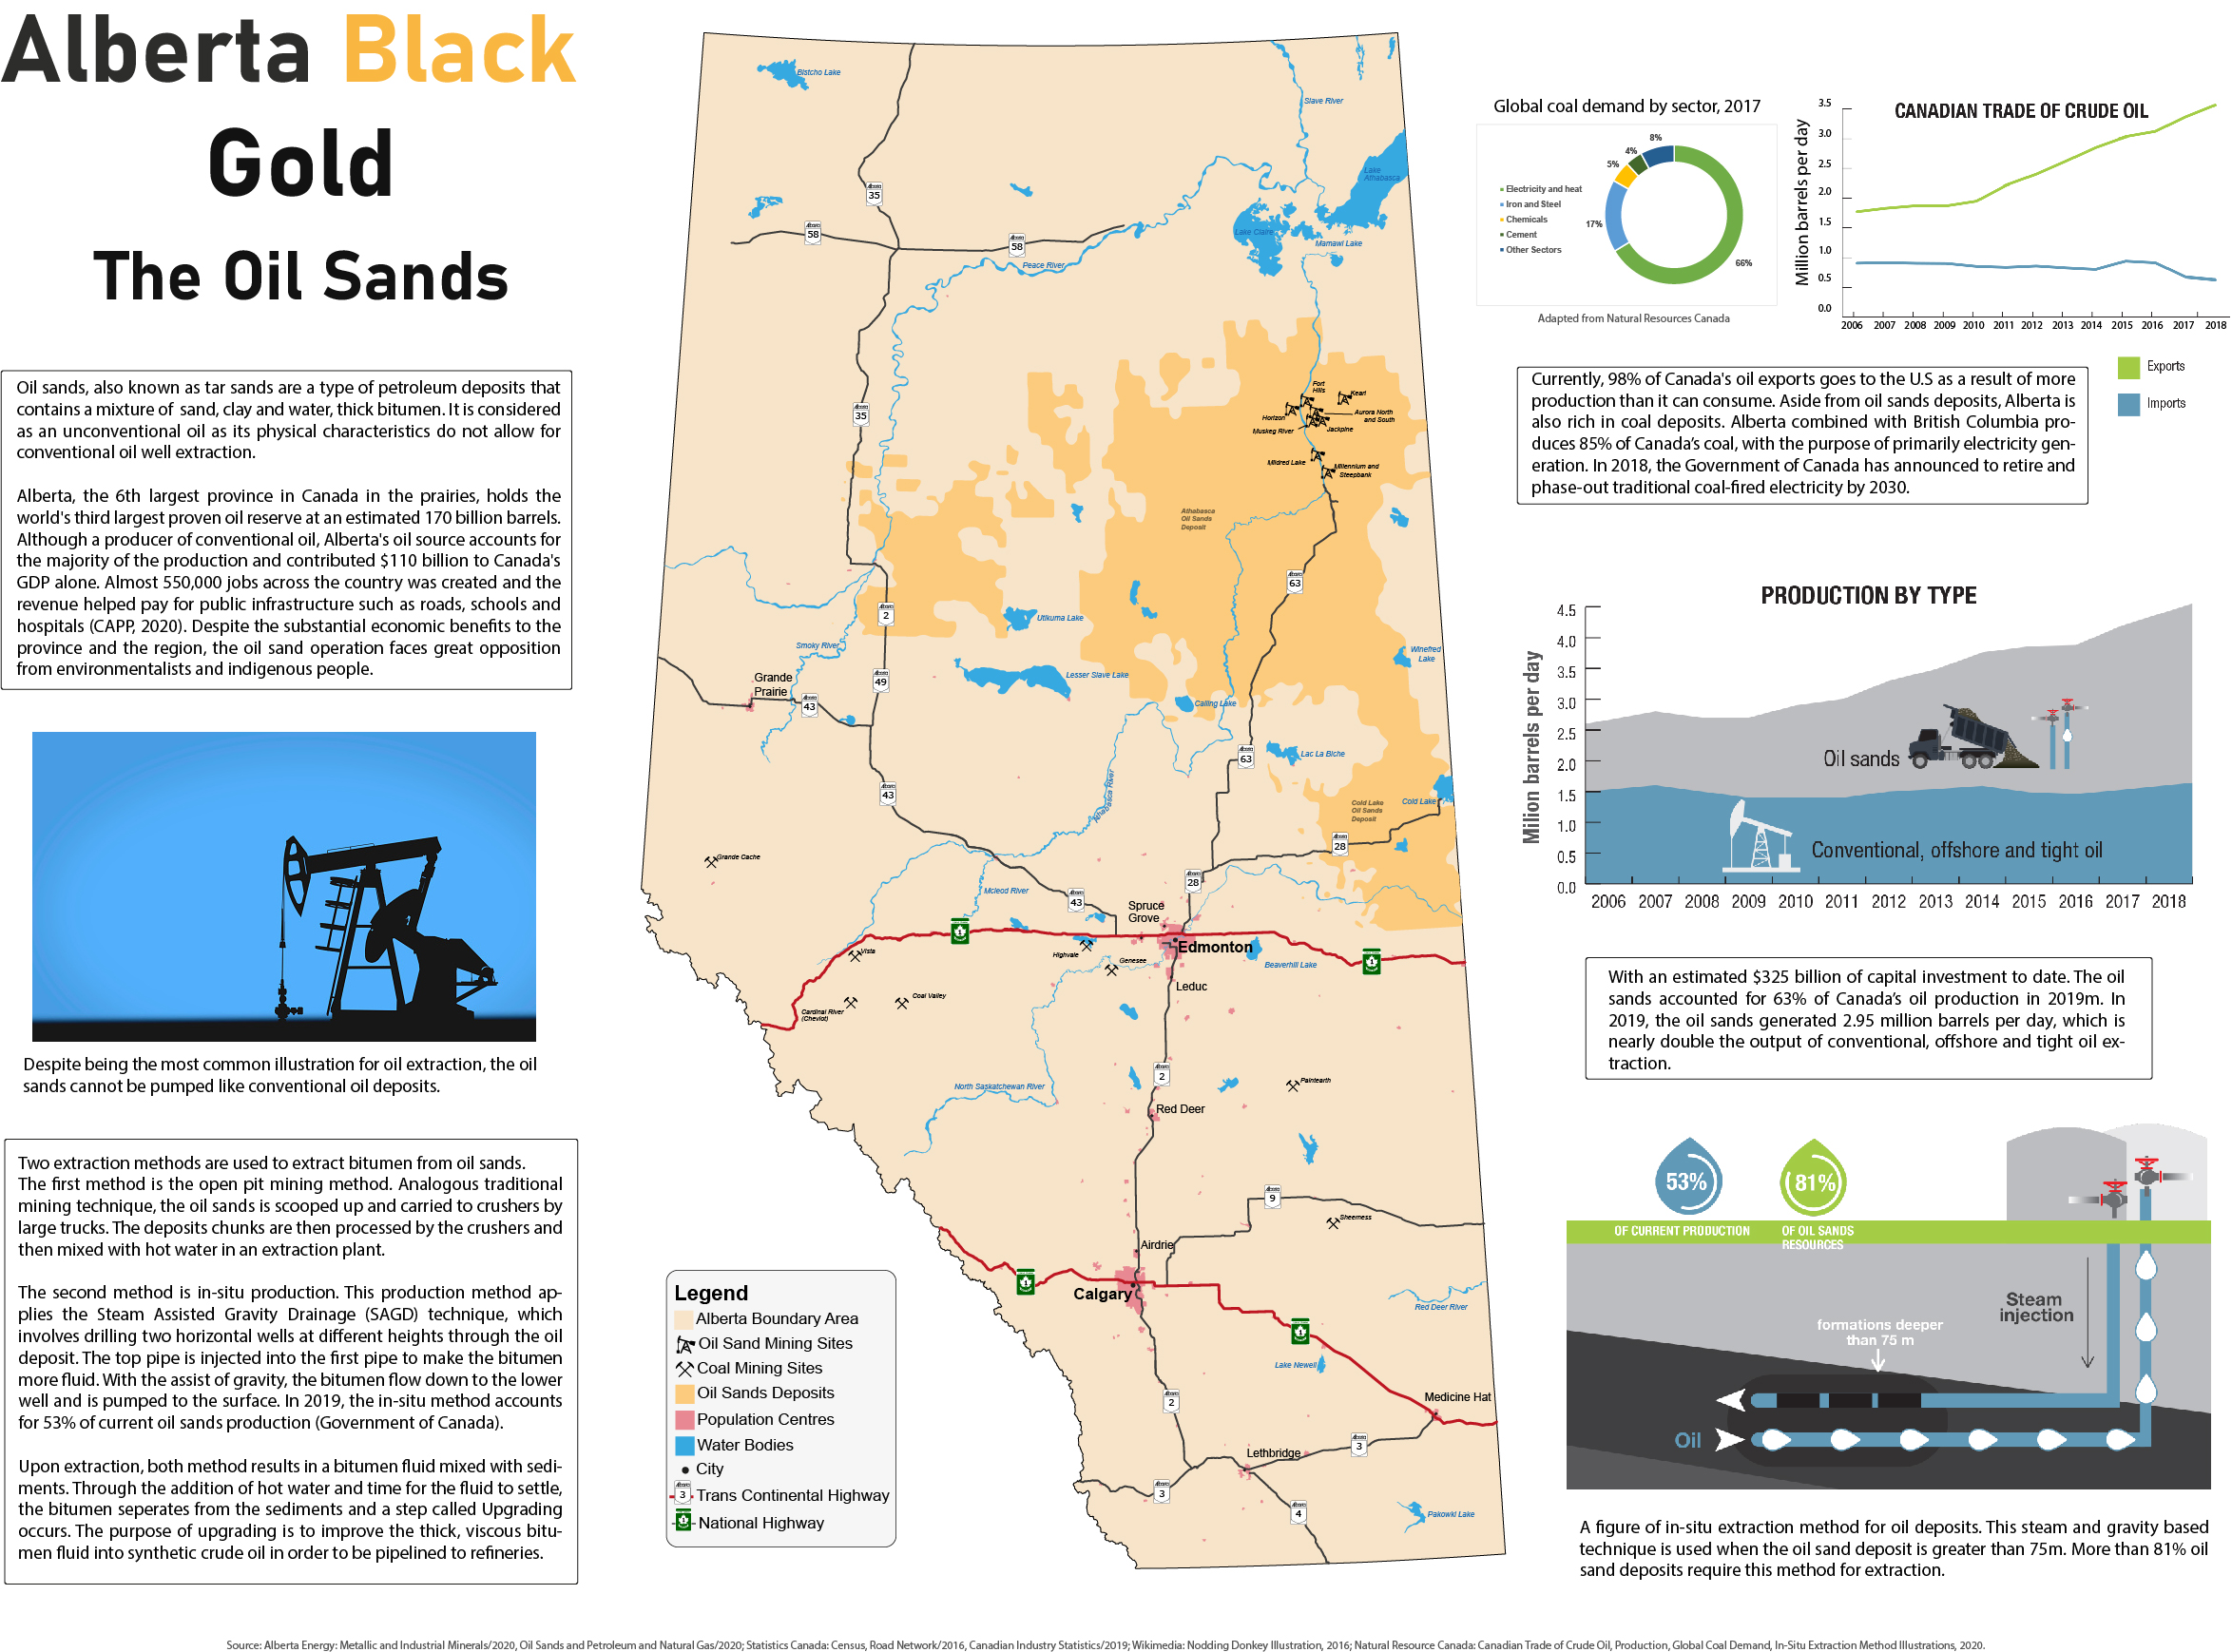
Geovisualization Capstone
As Jim Bergeson said, “Data will talk to you if you’re willing to listen to it.” My map takes an analytical approach into looking at oil sands and coal mines, the top two resources extracted in Alberta. Resource exploration is an essential part of maintaining our high standard of living in Canada. Whether it is driving our cars, heating our homes, or powering our offices, coal and petroleum products both play significant roles. The debate between traditional and alternative energy sources is becoming more heated as our climate changes. But before we make up our minds about which side to take, we must first look at the data.
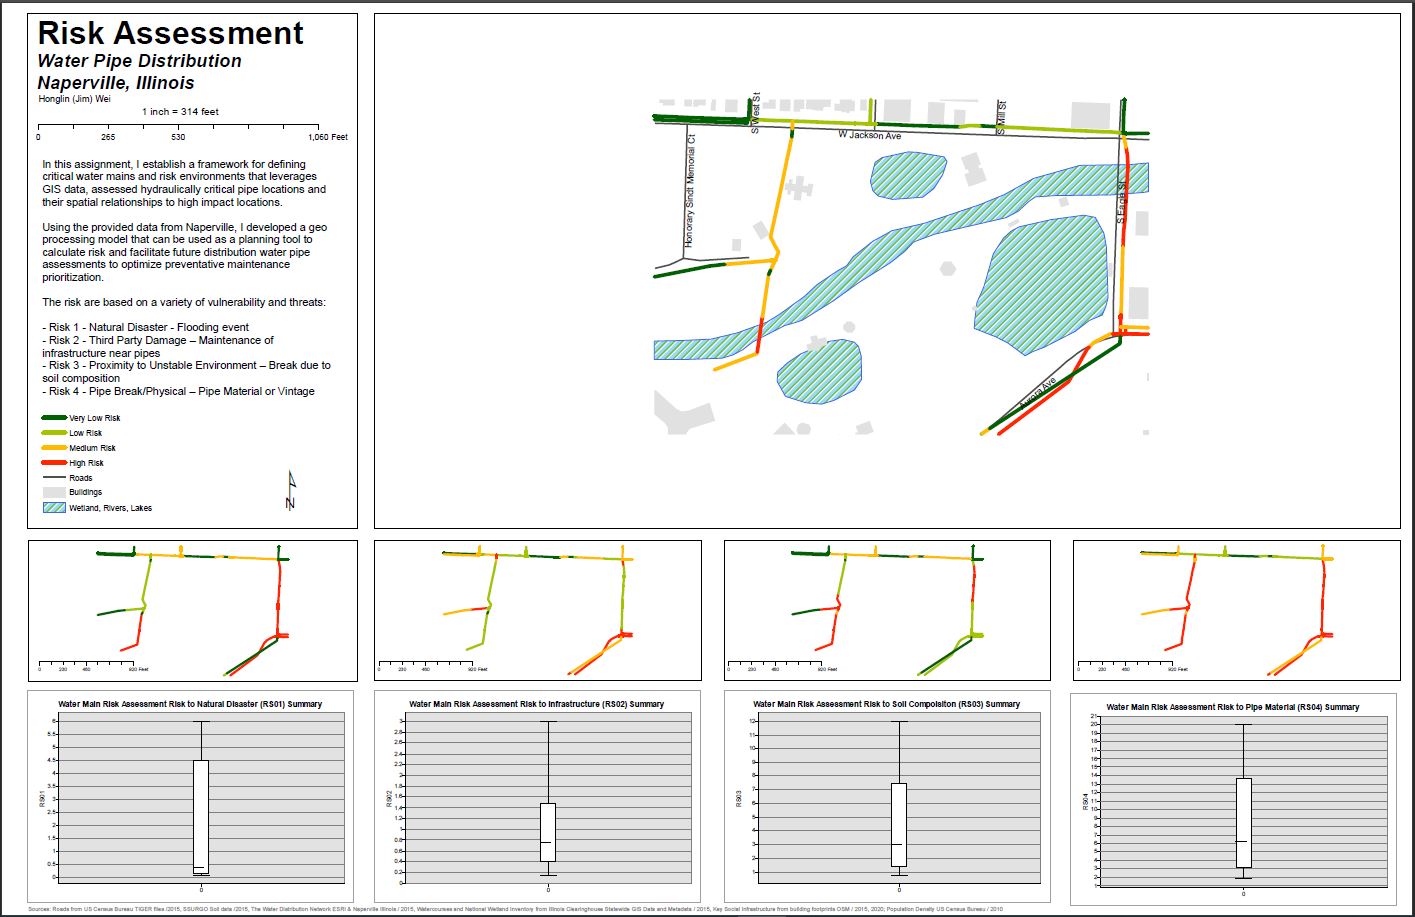
Naperville Water Main Risk Analysis
The water distribution network is very crucial in maintaining a standard of living in day to day life within a municipality. What happens when our water mains burst and they stop coming to our homes?
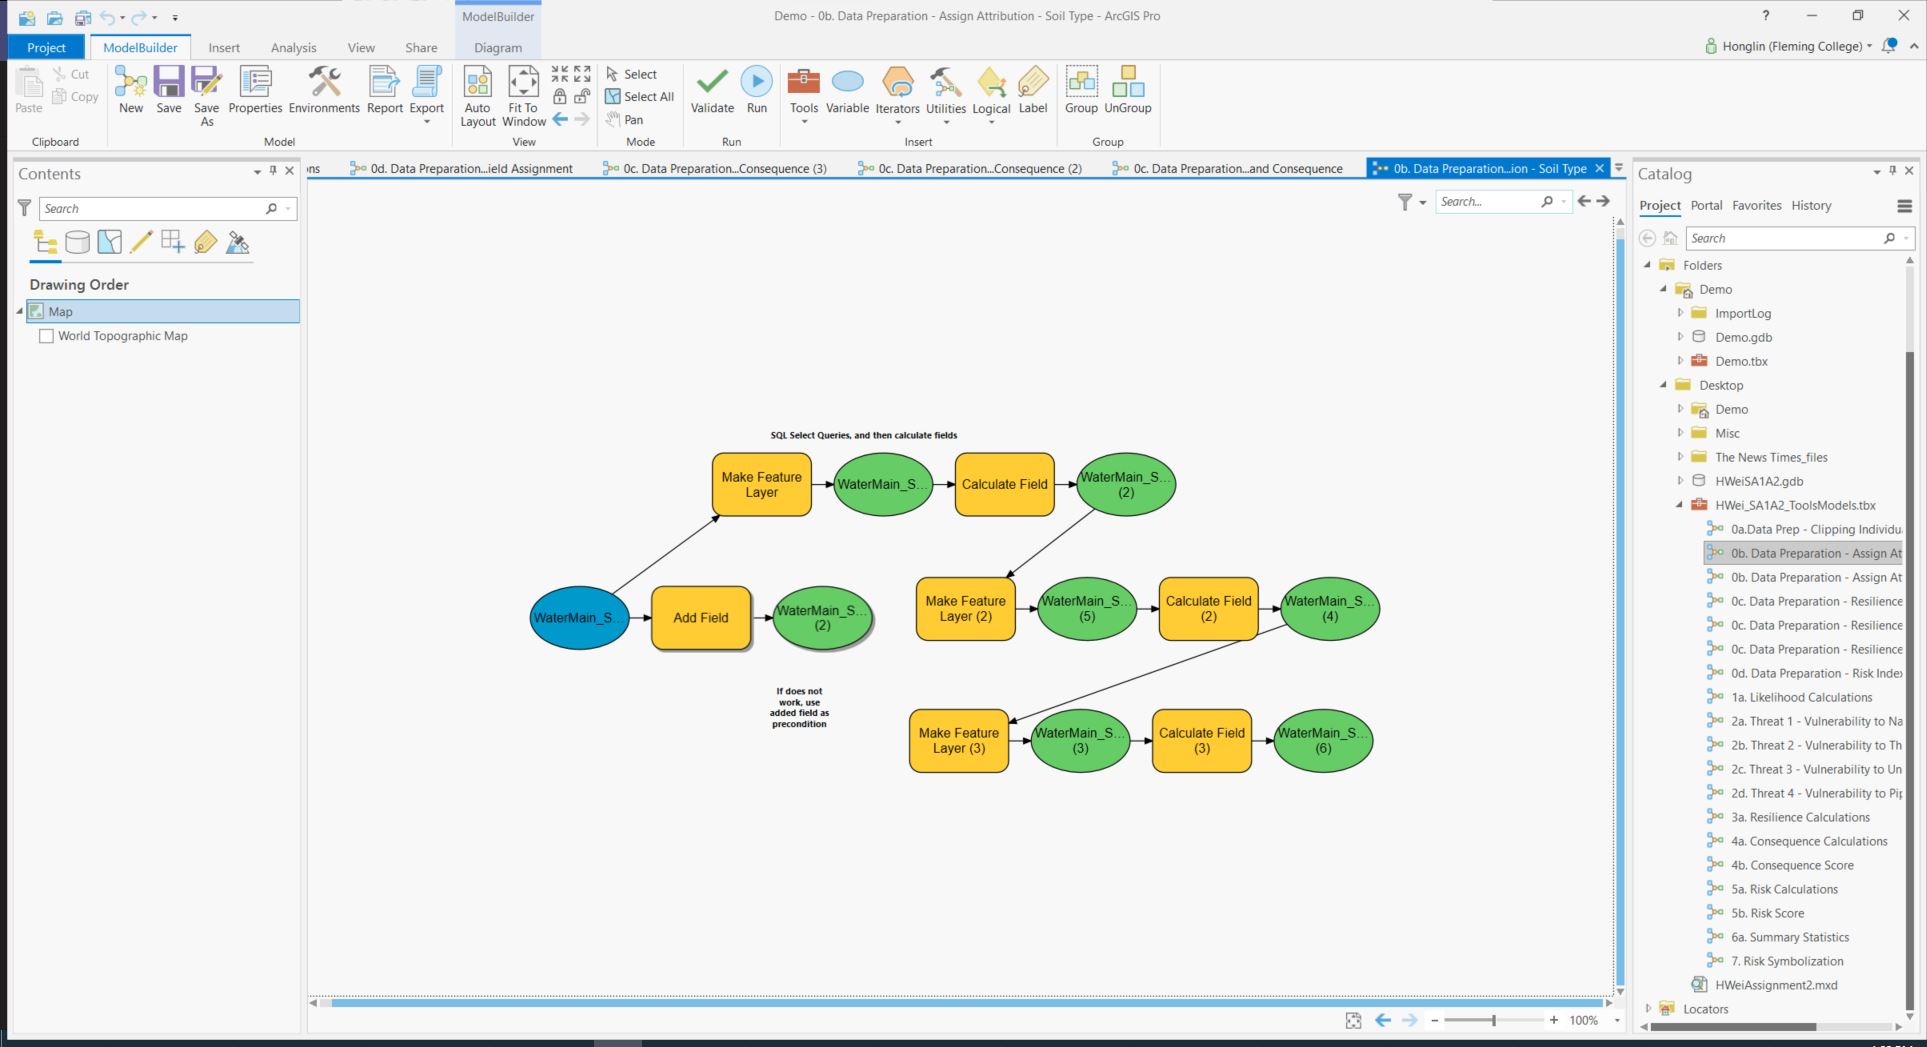
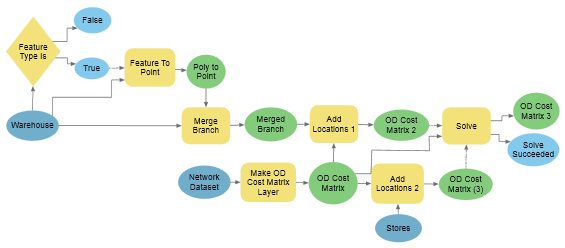
In this spatial analysis project, I used infrastructure data within Naperville to assess hydraulically critical pipe locations and their spatial relationships to high impact locations using a pre-existing framework from GHD consulting by Marikka Williams. A geoprocessing model was created to calculate risk and facilitate future distribution water pipe assessments. The work done here will to allow prioritizing maintenance to reduce the likelihood of a water pipeline catastrophe.
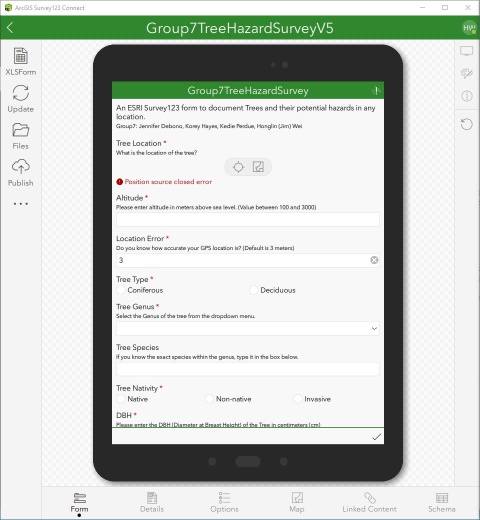
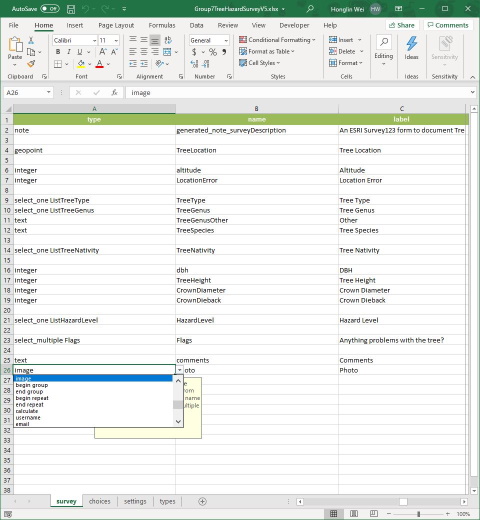
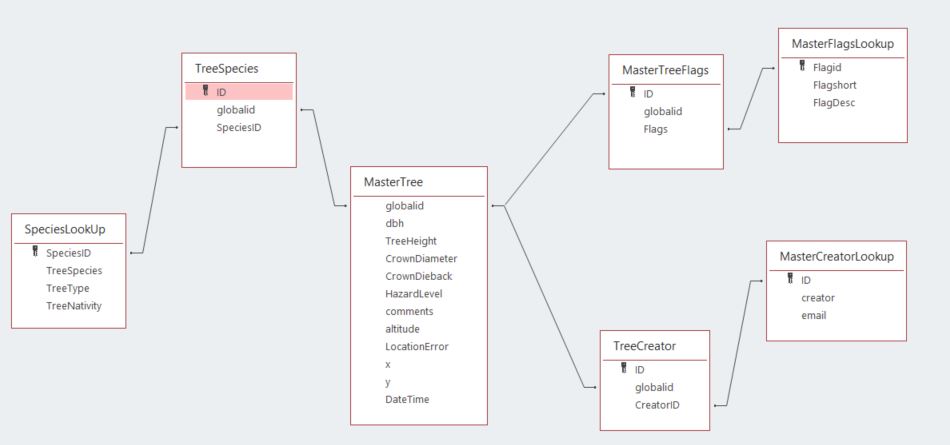
Ontario Tree Relational Database
This project involved designing a data-collection database using Survey 123 and exporting to Access (Called an ETL, or Extract-Transform-Load process). The scope of this project involved tagging trees within Ontario and determining their species. One of the key challenges in this project was integrating multiple databases with different structures via migration. I worked with a small team to produce a database consisting of over 1300 unique entries and performed QA/QC to ensure database accuracy and efficiency.
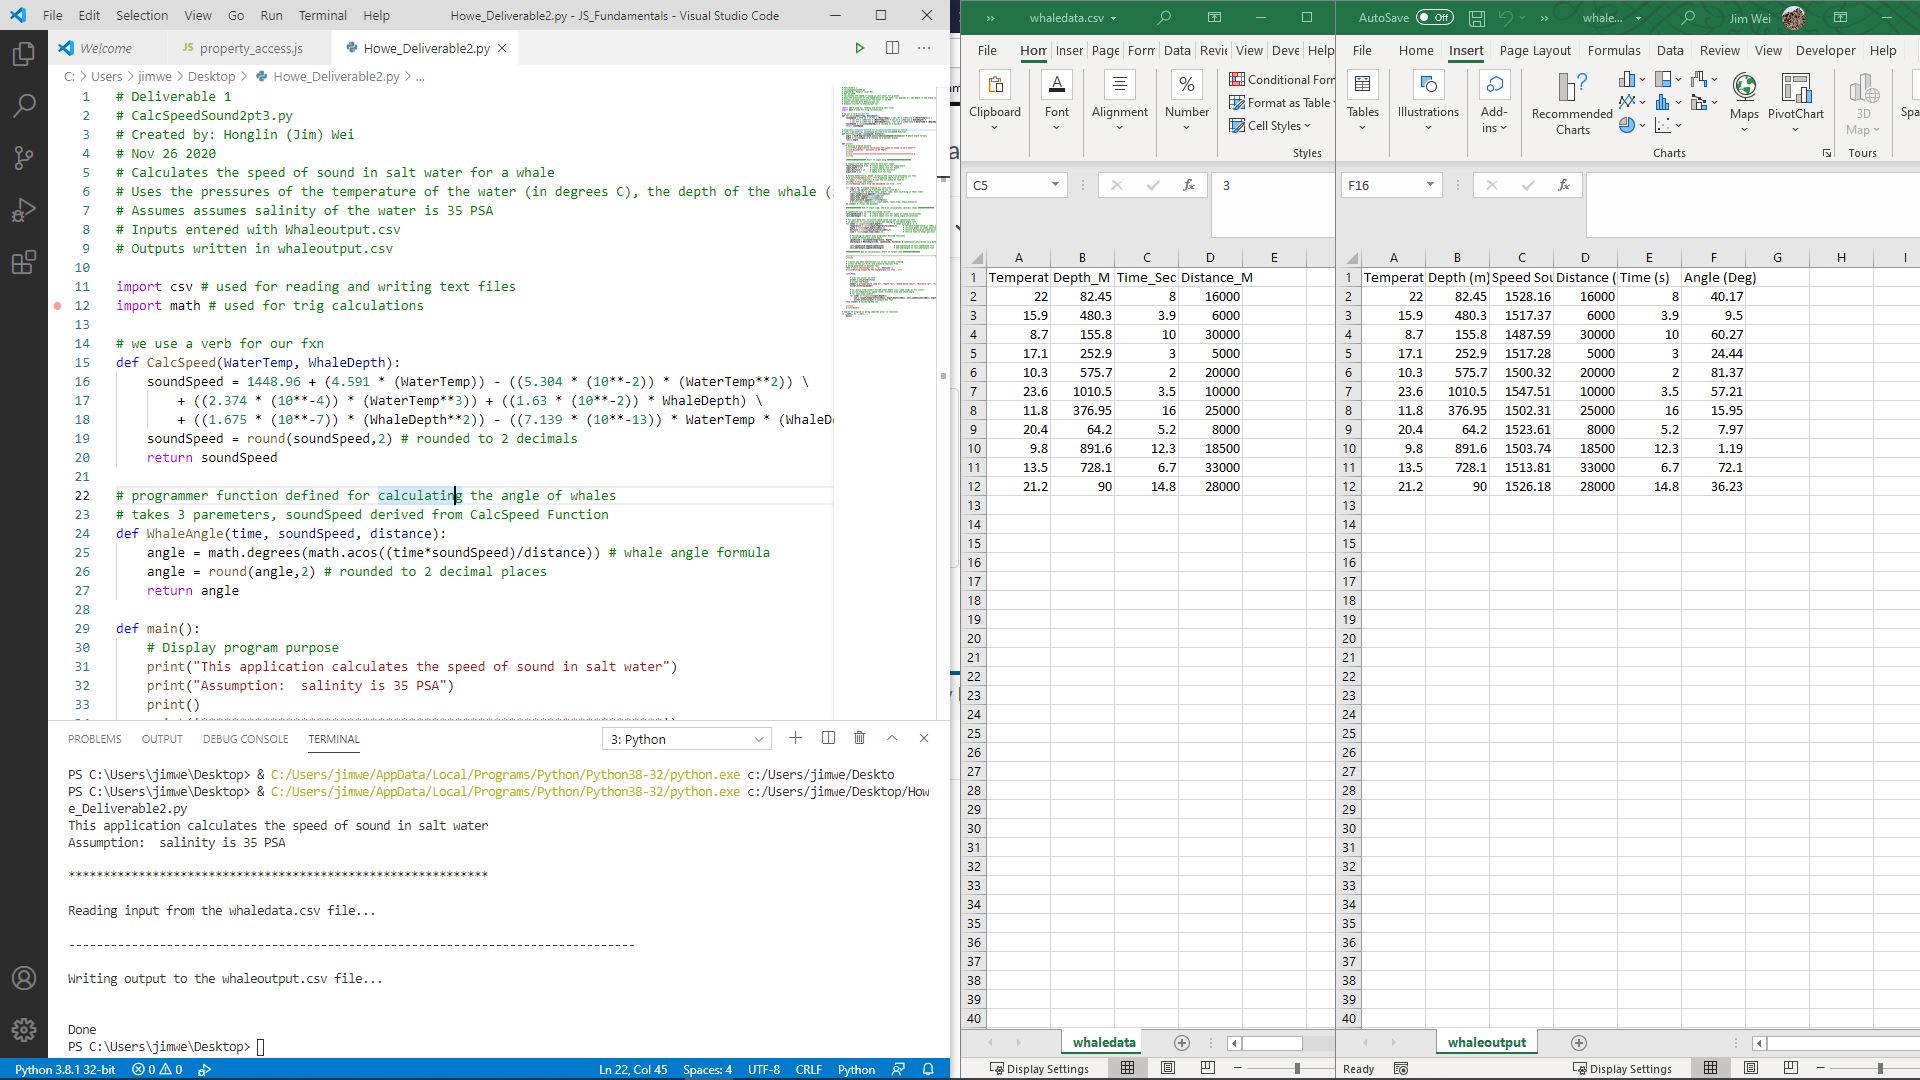
Problem Solving With Python
As of today, there are about 400 North Atlantic right whales left in the world. More than 20 whales have died in the Atlantic coast, likely due to human activities such as ship accidents and pollution. In this project, I produced an application using python 3.8 to conduct real time whale location. Using hydrophone distributed across the ocean, we were able development an algorithm based on salinity and ocean water assumptions to locate the direction of whales.
Unlike previous Fleming graduates, this year’s GIS Application Specialists began to compile ArcPy Automation Scripts in ArcGIS Pro using Python 3.x. There are endless possibilities and automation that can be replace pre-existing geoprocesses.
Jim Honglin Wei
GIS Applications Developer
My interests include building GIS Applications, Remote Sensing, Web Development and data science.